Two surveys cross your desk.
The first is an applicant survey sent to 10,000 candidates that brought in 400 responses, a seemingly dismal 4% candidate survey response rate.
The second is an interview feedback survey sent to 200 candidates that brought in 50 responses, a respectable 25% response rate.
Your instinct is to trust the 25% survey and dismiss the 4% survey as a failure. But the math tells the exact opposite story: the 4% survey gives you a razor-sharp result accurate within +/- 4.8 percentage points, while the 25% survey carries a wide +/- 12.2 point margin of error.
As TA and HR leaders, this runs against everything traditional response rate benchmarks have trained us to believe, and it matters enormously for talent acquisition, because TA teams live at both ends of that range. You survey tens of thousands of applicants at the top of the funnel and a few dozen declined offers at the bottom, and the instinct is to treat the small numbers as unusable. Usually they are not.
The number that matters is not your candidate survey response rate
Candidate survey response rate is a quality signal. It tells you something about how well you are engaging people and how much risk you are carrying from the ones who stayed silent. It is worth improving.
But response rate is not what determines statistical precision. What determines precision is the raw count of responses, and how that count compares to the size of the group you drew them from.
A 2% response rate from 25,000 applicants and a 60% response rate from 40 declined offers are not on the same scale at all, and the one that sounds better on a slide is not necessarily the one carrying more statistical weight.
Three terms, in plain English
Population. The group you are trying to understand. Everyone who applied last quarter. Everyone who declined an offer. Everyone in the 30-day new hire cohort. Not the whole company, and not everyone who ever touched your career site: just the specific group this survey is about.
Confidence level. How often you want your method to be right. At 95% confidence, if you ran the same survey a hundred times with a hundred different random samples, the range you calculated would contain the true answer in 95 of them. Ninety-five percent is the research standard. Ninety percent is common for internal, directional work.
Margin of error. How far off your number could reasonably be. If 72% of respondents rate your interview process favorably and your margin of error is 6 points, the true figure across the whole group is somewhere between 66% and 78%.
That last point deserves emphasis, because it is the one people skip. A survey result is never a single number. It is always a range. The 72% on your dashboard is the middle of a range, and the question is only ever how wide that range is.
Why the “you need 385 responses” rule does not apply to you
You have probably seen the claim that roughly 385 responses gets you to a 5-point margin of error at 95% confidence, and that this holds whether you are surveying a city or an entire country.
That is true, and it is also the source of the confusion.
It holds for very large populations. Once the group you are sampling from is big enough, its exact size stops mattering. Surveying 100,000 people and 100 million people requires almost identical sample sizes, which is genuinely surprising the first time you encounter it.
But that rule breaks down in the direction nobody talks about. When your population is small, each response covers a much larger share of it, and precision improves fast.
Think of it as tasting soup. If you have a stockpot, one spoonful tells you about the whole pot. If you have a teacup, one spoonful is a significant fraction of the entire thing, and you learn even more. Statisticians call the adjustment a finite population correction. In practice it means that the smaller your population, the fewer responses you need to say something reliable about it.
This is the part TA teams are not being told. Your 24 responses from 40 declined offers are not a failed version of a real survey. They are a substantial share of a small, well-defined population, and the math treats them accordingly.
What this looks like across the hiring funnel
Here is a realistic quarter for a mid-sized enterprise talent team. Margin of error is calculated at 95% confidence, using the most cautious assumption, where opinion splits evenly.
| Survey point | People in the group | Responses | Response rate | Margin of error |
|---|---|---|---|---|
| Career site visitors | 25,000 | 400 | 2% | ±4.8 points |
| Applicants | 4,000 | 300 | 8% | ±5.4 points |
| Interviewed candidates | 600 | 180 | 30% | ±6.1 points |
| Offers extended | 120 | 70 | 58% | ±7.5 points |
| New hires, 30-day check-in | 80 | 55 | 69% | ±7.4 points |
| Declined offers | 40 | 24 | 60% | ±12.4 points |
Look at what happens down the left column. The response rate climbs from 2% to 60% while the raw response count collapses from 400 to 24. And the margin of error barely moves until the very last row.
Seventy responses from 120 offer recipients is a stronger position than most TA leaders assume. It sits within a point and a half of the precision you get from 400 career site responses, and nobody questions whether 400 responses counts.
The declined offer row is genuinely wide at ±12.4 points. That is a real limitation and worth being straight about. But it is also the row where the next point rescues you.
Lopsided answers are more precise than split ones
That ±12.4 assumes the worst possible case: your group splits perfectly down the middle, 50/50, maximum disagreement. Maximum disagreement means maximum uncertainty about where the true split falls.
Real feedback data rarely does that. When you ask candidates why they declined, the answers are usually lopsided, and lopsided answers are easier to pin down.
Take that same declined offer survey. Twenty-four responses from a group of 40, and 85% of them point to compensation. The true figure across all 40 people sits between roughly 74% and 92%.
That range is wide. It is also completely decisive. Even at the most pessimistic end of it, roughly three out of four people who turned you down did so over pay. You do not need more precision than that to know what to bring to your next compensation conversation. The decision is the same anywhere in the range.
This is the practical test, and it is a better one than any significance threshold: would a different number inside your range change what you do? If the answer is no, you have enough data. If a 5-point swing would flip your decision, you need more.
Try it with our handy calculator
How much confidence is in your survey?
Enter the size of the group you surveyed and how many people responded. The result shows how close every percentage in that survey sits to the truth.
Guidance
Calculated with a Wilson score interval adjusted for population size, using the most cautious assumption of an evenly split group. Lopsided results are more precise than this figure shows. Confidence intervals describe sampling error only. They assume the people who responded are broadly like the people who did not.
What a confidence interval will not tell you
Confidence intervals measure one kind of error: the randomness that comes from asking some people instead of all of them. They assume the people who responded are broadly similar to the people who did not.
In candidate and employee feedback, that assumption deserves scrutiny. Declined offer surveys can pull disproportionately from candidates who left with strong feelings in either direction. Engagement surveys can under-represent the disengaged, who are the people you most need to hear from. No confidence calculation detects this, because the math has no way of knowing who is missing.
So use the statistics for what they are good at, and manage the rest with survey design:
- Survey at the moment of the experience, not weeks later, while recall is accurate and willingness is highest.
- Keep it short. Length is the single biggest driver of abandonment.
- Ask everyone in the population rather than a hand-picked subset, so non-response is the only filter.
- Watch whether respondents match the population on the attributes you can see: source, req type, location, hiring manager, stage.
- Read the open-text comments next to the scores. Where a small sample is thin, verbatim responses tell you whether one dominant story is driving the number.
Precision and representativeness are two different problems. The calculator solves the first one. Your process has to solve the second.
Where this shows up in Survale
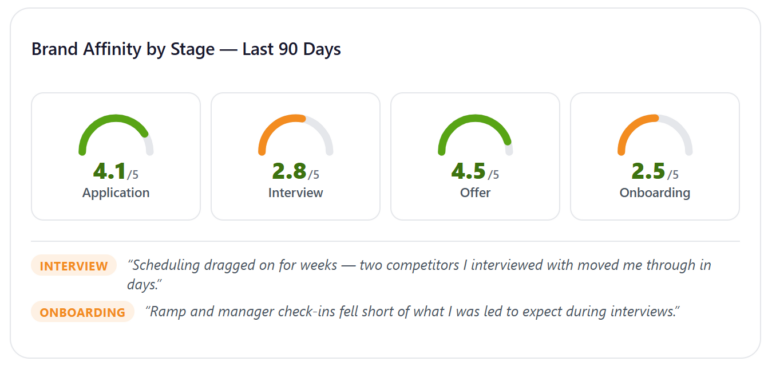
Survale now calculates a confidence score alongside important results so you can see the reliability of what you are looking at without leaving the dashboard or opening a spreadsheet. Users have the option of adding confidence scores to important widgets. Once added, the score shows up as a vertical line on the left side clearly showing the confidence level. And an informative tool tip tells you exactly how the level was calculated.
The point of the feature is straightforward. TA teams shouldn’t have to guess the validity of their data based on response rates or counts. The value is in the insights generated from the data and the comments and a quick indicator showing confidence levels accomplishes that.
The short version
- Your candidate survey response rate and your statistical precision are two different things.
- A small population needs proportionally fewer responses, not more.
- A survey result is a range, not a number. Confidence level and margin of error describe that range.
- Lopsided results carry tighter ranges than evenly split ones.
- The useful question is not whether a result is significant, but whether any number inside the range would change your decision.
- Statistics handle sampling error. Survey design handles who is missing. You need both.
FAQs
It depends on how many people were eligible to respond, not on your response rate. For very large groups such as applicants or career site visitors, around 384 responses gives you a 5-point margin of error at 95% confidence. For a group of 80 new hires, 67 responses reaches the same precision. For a group of 40 declined offers, 37 does.
Yes. Statistical precision comes from the number of responses relative to the size of the group, not from the percentage who replied. A 2% response rate from 25,000 applicants produces a margin of error of about 4.8 points, which is tighter than a 58% response rate from 120 offer recipients at 7.5 points.
A confidence level describes how often your method produces a range that contains the true answer. At 95% confidence, if you ran the same survey a hundred times with a hundred different samples, 95 of the ranges you calculated would contain the true figure for the whole group. Ninety-five percent is the research standard.
Margin of error is how far your reported percentage could sit from the true figure for the entire group. If 72% of respondents rate your interview process favorably and the margin of error is 6 points, the true figure across everyone you surveyed is somewhere between 66% and 78%.
A confidence score summarizes how reliable a survey result is, combining the number of responses with the size of the group they came from. It answers the practical question of whether a result is solid enough to act on, without requiring the reader to calculate a margin of error themselves.